Gold Price Analysis: Monday’s Doji keeps buyers hopeful with $1625 on radar
- Gold prices remain positive after marking the trend reversing candlestick formation the previous day.
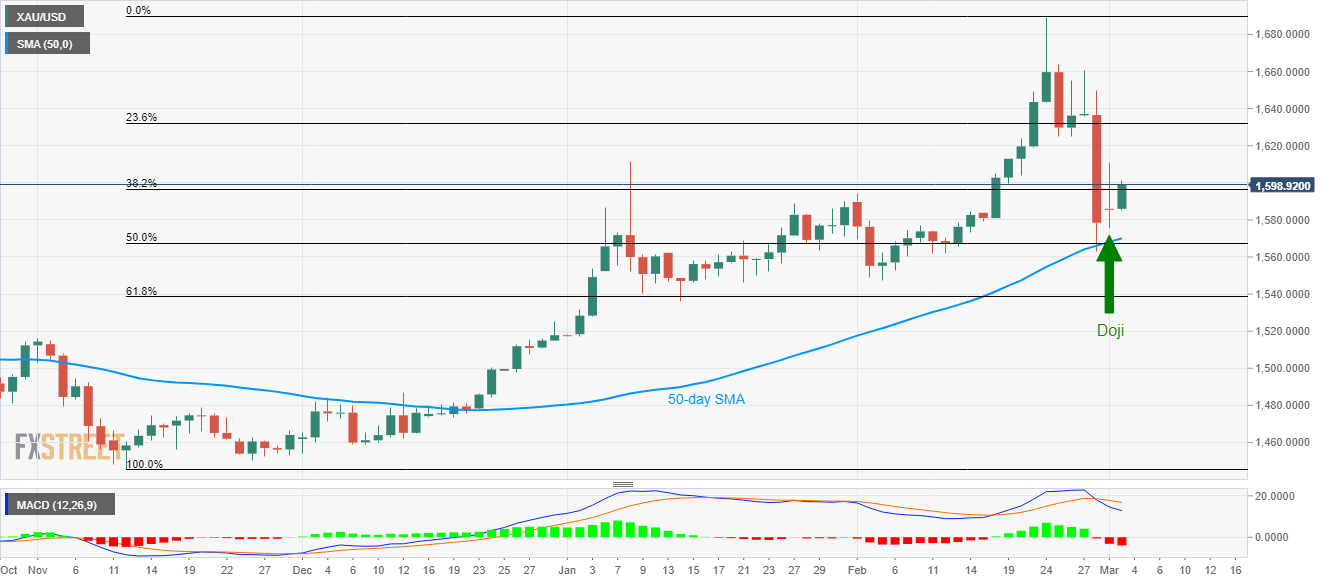
- 50-day SMA acts as short-term key support while lows marked on February 25/26 lure the buyers.
Despite repeated failures to take out $1,600, Gold prices remain 0.84% positive to $1599 while heading into the European open on Tuesday.
The yellow metal portrayed a trend-reversing candlestick formation on the daily chart on Monday, which in turn indicates the recovery in contrast to Friday’s slump.
That said, lows marked on February 25/26 around $1.625 seem to be on the short-term buyers’ radars.
Though, a sustained break of $1,625 enables the bulls to question $1,666 and $1,690 while targeting $1,700 during the further upside.
On the contrary, the bullion’s weakness below 50-day SMA level of $1,570 will drag it to 61.8% Fibonacci retracement of its run-up from November 2019 to February 2020, at $1,539.
It's worth mentioning that the upcoming conference call betwene the G7 leaders, around 12:00 GMT, will be the key to forecast gold price moves.
Gold daily chart
Trend: Bullish