Back
27 Feb 2020
Gold Price Analysis: XAU/USD can be at risk of correcting down further
- XAU/USD is consolidating gains below the 1660.00 level.
- A deeper retracement cannot be ruled out.
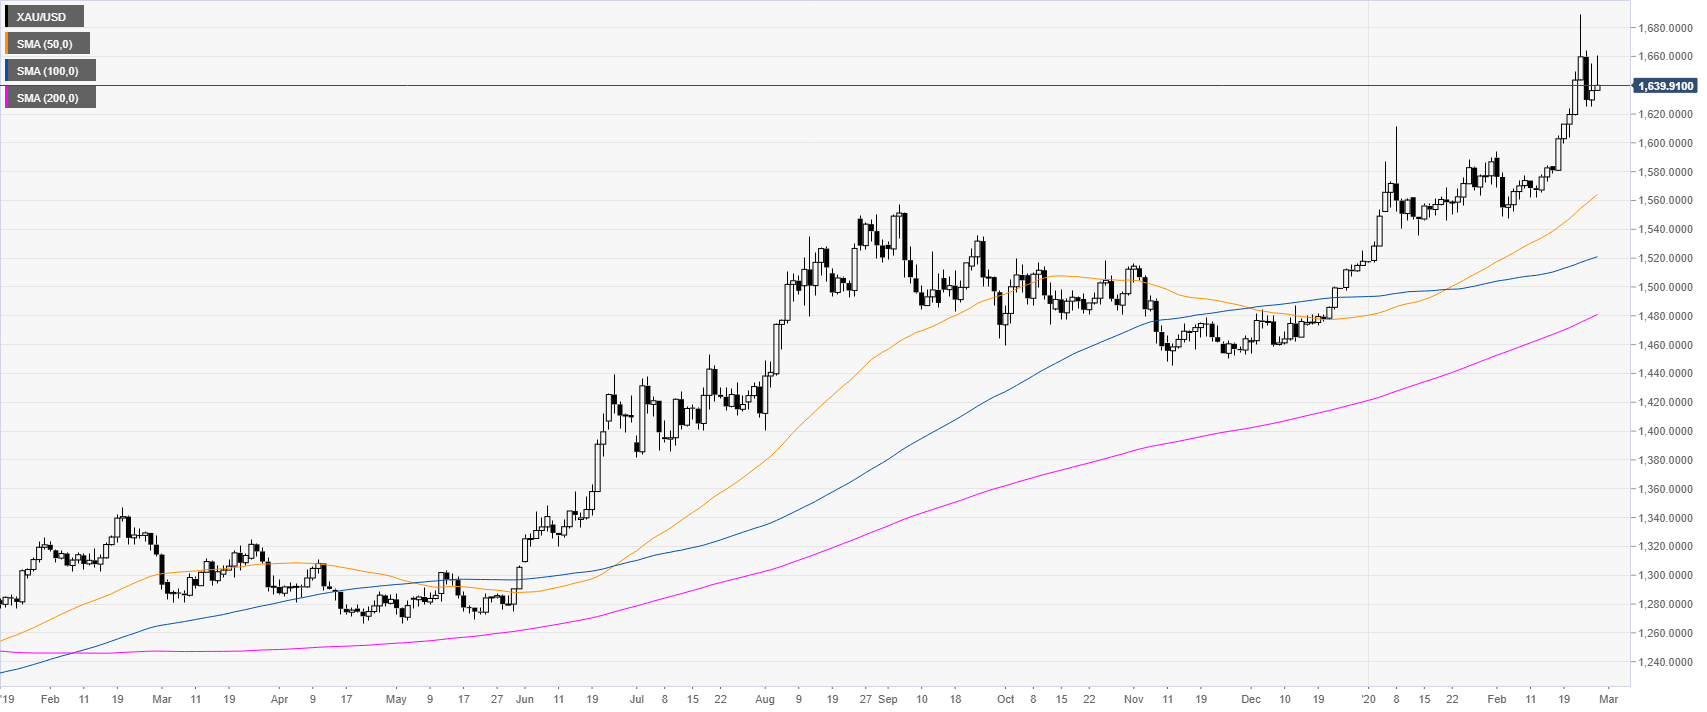
Gold daily chart
XAU/USD is trading in an uptrend above the main daily simple moving averages (SMAs) as the market is trading in seven-year’s highs.
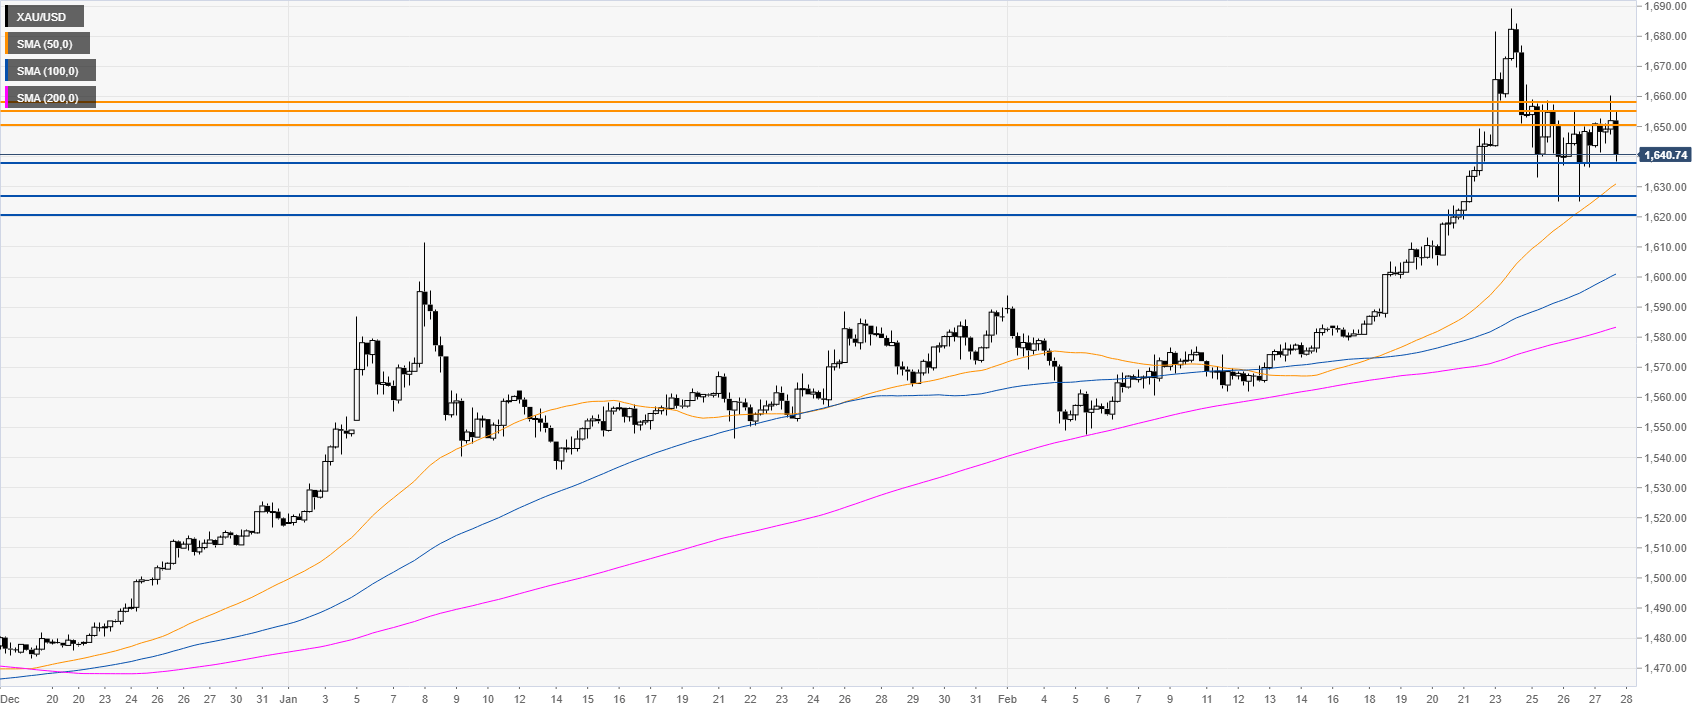
Gold four-hour chart
Gold has been easing from the 2020 top while trading above the main SMAs on the four-hour chart. While the trend is bullish a deeper correction down cannot be ruled out. A daily close below the 1638 support can lead to further retracements down towards 1627.86 and 1622.74 levels. Resistance can be expected near the 1650.00, 1655.00 and 1661.00 levels.
Additional key levels