Gold Price Analysis: Path of least resistance is up, $1,626 next target – Confluence Detector
Gold prices have surpassed the January high – triggered by the Iranian crisis – and have reached the highest since 2013. The coronavirus scare is among the upside drivers.
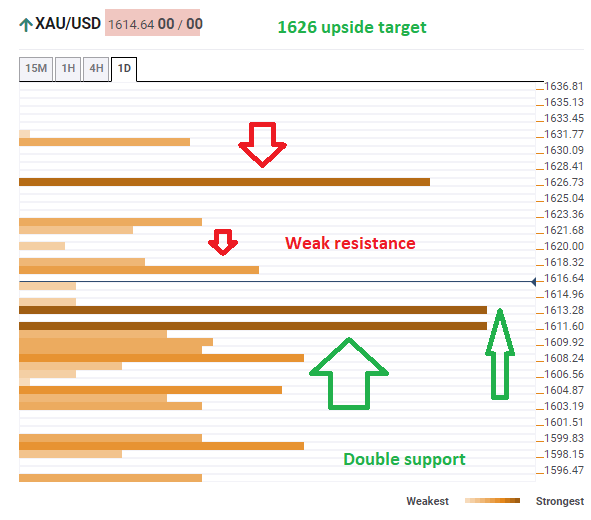
The Technical Confluences Indicator is showing that support lines are stronger than resistance, implying that the rally still has room to run.
XAU/USD is benefiting from two substantial clusters of support. The first is at $1,613 – above the January low – and it consists of the previous daily high and the Pivot Point one-week Resistance 3.
The next defensive barrier is at $1,611, which is the convergence of the Simple Moving Average 50-15m, the SMA 10-1h, and the January high.
Looking up, weak resistance awaits Gold at $1,617, which is the confluence of the Bollinger Band one-hour Upper, the SMA 5-15m, the SMA 10-15m, and the Pivot Point one-day Resistance 1.
The upside target is $1,626 where XAU/USD faces fiercer resistance – the long-term Pivot Point one-month Resistance 1 awaits it there.
Overall, the precious metal's price has significant cushions and few junctures of resistance lines, allowing for more rises.
Here is how it looks on the tool:
Confluence Detector
The Confluence Detector finds exciting opportunities using Technical Confluences. The TC is a tool to locate and point out those price levels where there is a congestion of indicators, moving averages, Fibonacci levels, Pivot Points, etc. Knowing where these congestion points are located is very useful for the trader, and can be used as a basis for different strategies.
This tool assigns a certain amount of “weight” to each indicator, and this “weight” can influence adjacents price levels. These weightings mean that one price level without any indicator or moving average but under the influence of two “strongly weighted” levels accumulate more resistance than their neighbors. In these cases, the tool signals resistance in apparently empty areas.
Learn more about Technical Confluence